Does Your Metabolic Rate Really Slow Down with Age? Science Says — Not Until 60! A recent large scale study in Science analysed data from over 6,400 people aged 8 days to 95 years and identified four distinct phases of metabolism across the human lifespan.1
These results strongly suggest we may no longer be able to blame weight gain in our 40’s on a slow metabolism.
But metabolism is not static. Over our lifetime, metabolic demands shift considerably, and maybe not as you expect.
In this post, I’ll walk through those four phases, what drives them, and why they matter.
Metabolic Rate Explained
Metabolism is the combination of all the chemical processes that allow an organism to sustain life.
For humans, this includes conversion of energy from food into energy for life-sustaining tasks such as breathing, circulating blood, building and repairing cells, digesting food, and eliminating waste.2
(It’s important not to confuse these lifespan phases with biochemical metabolic pathways such as glycolysis.)
Basal metabolic rate (BMR) is the minimum amount of energy needed to carry out these basic processes while at rest (fasting/asleep).
This can be calculated using online calculators that take into account an individual age, sex, height and weight.
BMR is also known as resting metabolic rate (RMR).
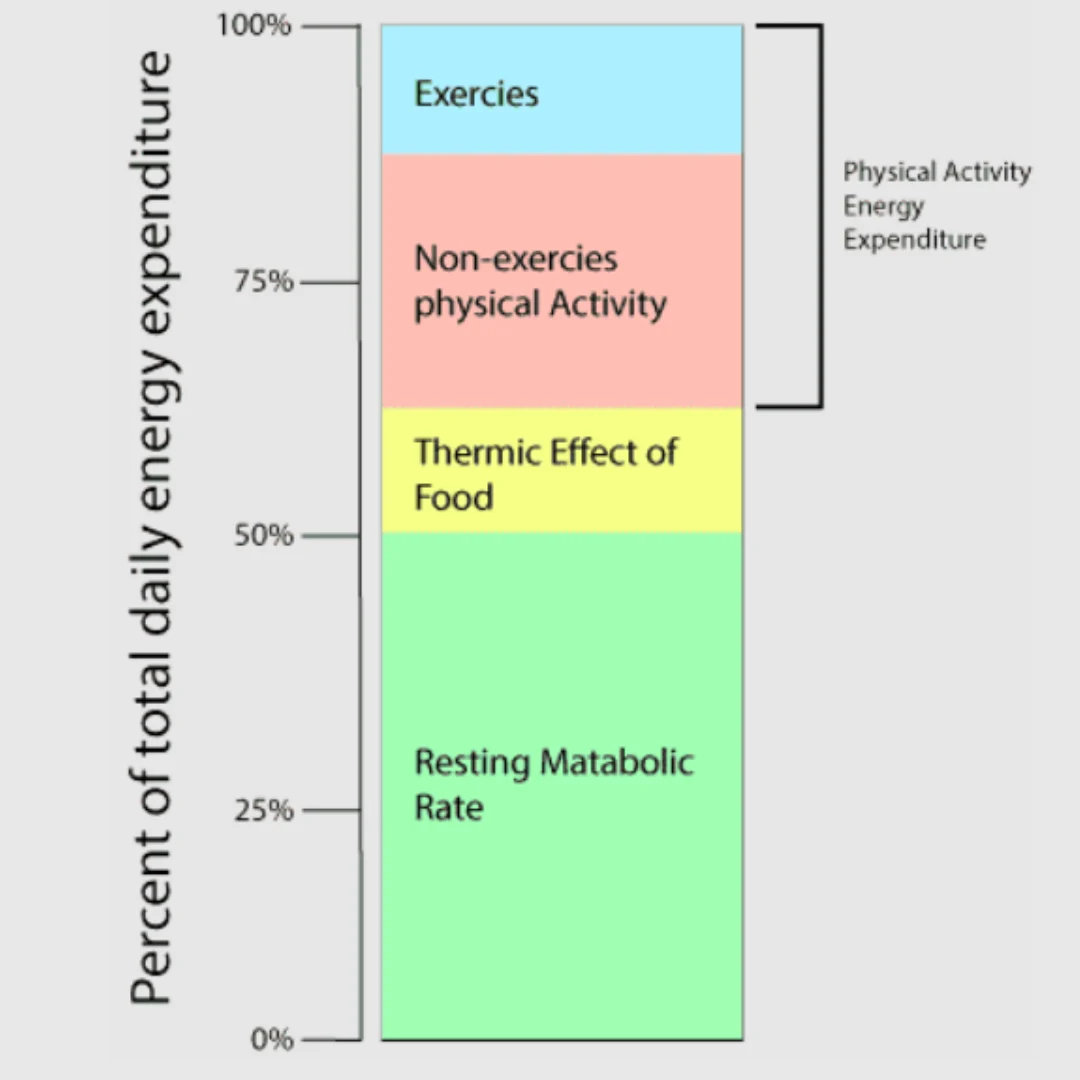
BMR accounts for about 50% to 70% of total energy output for the average sedentary adult.
The remaining energy expenditure is typically:
Physical activity: 20-30% This includes exercise plus non-exercise activity (NEAT) such as cleaning, typing etc.. think any movement that uses energy that isn’t ‘exercise’ – it accounts for using more calories than you might think!
Dietary thermogenesis: 10-15% (energy used to digest food). Protein is the most thermogenic food group requiring the most energy (calories) to digest.
Total energy expenditure (TEE) = a combination of BMR, plus energy used for physical activities and energy used to digest food (dietary thermogenesis).
Recent studies3 show that TEE has been declining since the late 1980s giving rise to the rise of obesity.

Obesity is caused by a prolonged positive energy balance (too much energy going in and not energy enough going out).
But metabolism is not static. Over our lifetime, metabolic demands shift considerably.
Phase 1: Infancy – The Metabolic Peak
Age range: Birth to ~1 year
- Babies burn calories faster than any other age group, about 50% higher than adults (adjusted for body size).
- This fuels rapid growth, brain development, and muscle and organ formation.
- The infant body prioritises growth and repair, not efficiency.
- A global study measuring total energy expenditure (TEE) using doubly labeled water across ages 8 days to 95 years found that by around 0.7 years, adjusted energy expenditure peaks at nearly 50 % above adult levels.
Takeaway: Infants’ metabolic rates are disproportionately high:
(1) organs such as heart, brain, kidneys are metabolically expensive relative to body size,
(2) Infant growth is also energetically costly.
Phase 2: Childhood & Adolescence – The Efficiency Shift
Age range: 1–20 years
- As growth continues, metabolism per unit of body mass gradually decreases.
- Surprisingly, even during puberty, metabolic rate (adjusted for size) continues to decline slightly.
- The body is becoming more energy-efficient as tissues mature.
- Interestingly, during puberty (ages ~10–15), the study noted no increase in adjusted metabolic rate; it continues its gradual decline until about age 20.
- This phase reflects a shift: growth continues, but the relative metabolic “overhead” per unit body mass declines. The body becomes more “efficient” as tissues mature and structure stabilises.
Takeaway: Even during growth, metabolic intensity per unit of mass decreases — the body becomes more efficient.

Phase 3: Prime Adulthood – The Stable Years
Age range: 20–60 years
- The Science study found that metabolism stays remarkably stable during adulthood.¹
- Both basal metabolic rate (BMR) and total energy expenditure (TEE) remain consistent when adjusted for body composition.
- This means your metabolism at 40 is virtually the same as it was at 25 — assuming no major changes in muscle mass or activity.
- The large scale study found that adjusted TEE and RMR plateau in these years.
- Only beyond certain thresholds do declines begin: for RMR at ~46.5 years and TEE at ~63 years.
- In practical terms, in this phase the body’s energetic demands are dominated by maintenance, repair, daily activity, and baseline organ function — less by growth or decline.
So Why Do Middle-Aged People Think Their Metabolism Has Slowed?
Because lifestyle, not biology, changes most during midlife:
- Muscle mass decreases (sarcopenia), especially without resistance training.
- Activity levels drop — fewer steps, less intensity, more sedentary work.
- Caloric intake often stays the same, creating a subtle energy imbalance.
- Sleep and stress can affect appetite-regulating hormones, leading to perceived “metabolic slowdown.”
In other words, metabolism hasn’t slowed — we’ve slowed down.
Takeaway: The middle years are a metabolic “steady state,” where efficiency and balance are key.

Phase 4: Older Adulthood – The Gradual Decline
Age range: 60+ years
- Around 60, both total and resting energy expenditure begin to decline by about 0.7% per year, even after adjusting for body size.¹ (changes in body mass and composition (fat:muscle ratio).
- This reflects reduced organ metabolic activity, loss of lean tissue, and hormonal changes.
- Staying active and maintaining muscle can help slow this decline.
- The decline is steeper than what body loss alone would predict: adjusted TEE and RMR drop at about 0.7 % per year.
- By age 90+, adjusted total energy use is ~26 % lower than in middle age.
- Causes include loss of lean (metabolically active) tissue, reduced organ metabolic activity, hormonal changes, and decreased physical activity.
Takeaway: Aging brings metabolic slowing beyond mere weight or muscle loss, reflecting systemic changes in physiology.
Why These Phases Matter
Understanding metabolic phases has real implications:
- Nutritional planning — Calorie needs vary enormously across life stages. What’s sufficient (or excessive) for a toddler is quite different from what’s needed at 70.
- Disease risk & prevention — Age‐related metabolic slowing can contribute to obesity, sarcopenia, and metabolic disorders if nutrition and activity aren’t adapted.
- Drug dosing & pharmacokinetics — Metabolism of drugs also changes (via liver, kidney, enzyme activity), so dosing must adapt to age and metabolic function.
- Public health & policy — Recognising different “energy budgets” across populations helps tailor guidelines for diet, exercise, and aging strategies.
Key Takeaways
Human metabolism is not a fixed machine but a dynamic one, shifting as we grow, mature, and age.
The “four phases” framework offers a useful lens through which to understand how our energy needs evolve.
Infancy demands extraordinary metabolic investment; childhood and adolescence bring efficiency; adulthood maintains balance; and older age brings natural decline.
These insights remind us that what “metabolism” means — how much we need, how we use energy, how we manage health — is deeply contextual.
Tailoring nutrition, activity, and interventions to life stage is critical.
Metabolic Rate
| Life Phase | Key Feature | What’s Happening |
| Infancy | Peak metabolism | Energy fuels rapid growth and organ development |
| Child – Teens | Efficiency increases | Body refines energy use as growth slows |
| Adult (20–60) | Stability | Energy needs plateau when adjusted for muscle mass |
| Older Age (60+) | Gradual decline | Energy use falls due to muscle loss and organ changes |
Why This Matters
Understanding these phases helps explain how to maintain health at every age:
- Infants/children: Adequate nutrition supports growth.
- Adults: Focus on muscle preservation and activity to sustain energy balance.
- Older adults: Adapt diet and resistance training to counter decline.
Frequently Asked Questions:
Q. What are the 4 phases of metabolism?
Infancy: Supercharged — burns 50% more than adults.
Childhood/Teens: Gradually becomes more efficient.
Adulthood (20–60): Steady — metabolism doesn’t really slow!
Older Age (60+): Finally starts to decline by ~0.7% a year.
Q. So why does it metabolism feel slower in midlife?
It’s probably lifestyle: less movement, less muscle, and the same calories.
Your metabolism is more resilient than you think — it just needs a little help to keep up.
The fix? Move more, lift weights, eat protein, sleep well.
Q. Why do most of us assume our metabolism starts to slow in our 30s or 40s?
Most of us start to notice weight gain in our 30’s and 40’s and blame our metabolism as we don’t usually understand why we are gaining weight.
Surprisingly, a 2021 Science study found metabolic rate stays steady from 20 to 60.
What we don’t see however is that small differences in our lifestyle have likely been compounding over many years, even decades:
This can include less physical activity, more sedentary either during the day or in the evening (or both), less muscle mass as we age, more stress, more calories, broken sleep and for women hormonal chaos which for most brings abdominal fat. A combination for guaranteed weight gain.
Q. How can I increase my metabolism?
Build muscle, stay active, eat enough protein, sleep well, and stay hydrated.
1. Build Muscle
Muscle burns more calories at rest than fat. Strength training (like lifting weights or bodyweight exercises) increases muscle mass, which boosts your resting metabolic rate—meaning you burn more calories even when you’re not moving.
2. Stay Active
Regular movement—especially cardio (like walking, running, or cycling)—burns calories and keeps your metabolism elevated. Adding short bursts of intense effort (HIIT) can give your metabolism a longer-lasting boost after exercise.
3. Eat Enough Protein
Digesting protein uses more energy than fats or carbs (called the thermic effect of food). Eating protein-rich meals helps you burn more calories through digestion and also supports muscle maintenance and growth.
4. Sleep Well
Lack of sleep can slow your metabolism and mess with hunger hormones, making you crave more food and store fat. Quality sleep helps regulate metabolism, hormones, and energy levels.
5. Stay Hydrated
Water is essential for metabolic processes. Drinking enough (especially cold water) can temporarily boost metabolism and help with fat oxidation. Even mild dehydration can slow down your metabolic rate.
Q. Can Green Tea boost metabolic rate?
Yes, Studies show Green tea contains natural compounds like caffeine and EGCG that may slightly boost metabolism and help the body burn fat more efficiently—especially when combined with exercise.

Apple Cider Vinegar Supplement
Pretty Pea brings you Apple Cider Vinegar supplement at its best. Combining Apple Cider Vinegar capsules into a complex formula that includes Chromium plus Green Tea Leaf, Cayenne, Ginger Root, Turmeric and Organic Black Pepper.


